Droughts Forecasting
Motivation & Objective
Since 1980, the US experienced 26 major droughts, each event averaging a cost of $9.6 billion. It is also well known that droughts frequency and intensities will increase in the US and globally. It is thus interesting to build droughts prediction models that could be able to generalize well and to predict droughts with the greatest possible lead times.
Using weather time series, previous drought scores and static soil data, I compare the performance of Linear Regression, Gradient Boosted Trees, Dense Neural Network, and LSTM to perform droughts forecasting.
Data
The dataset used for this project is composed of daily weather observations in the US, that come from
the
NASA POWER (Prediction of Worldwide Energy Resources) Project, of soil data that come from the
Harmonized
World Soil Database, and of drought score that come from the U.S. Drought Monitor.
Weather data: The weather data contains daily observations of 18 weather variables
(Temperature, Wind, Humidity, Precipitations, etc. information) in the US, at a county level (each of
them
represented by a FIPS code). It is already split in three sets: a train set, a validation and test set
that
all cover 3058 counties, respectively from 2000 to 2016, 2016 to 2018 and from 2018 to 2020.
Soil data: The soil data is static data that contains around 30 variables concerning
the
soil agricultural characteristics (distribution of slopes levels, aspects, land use, etc. in each
county).
This data is available for every county that either appears in the train, or in all timeseries.
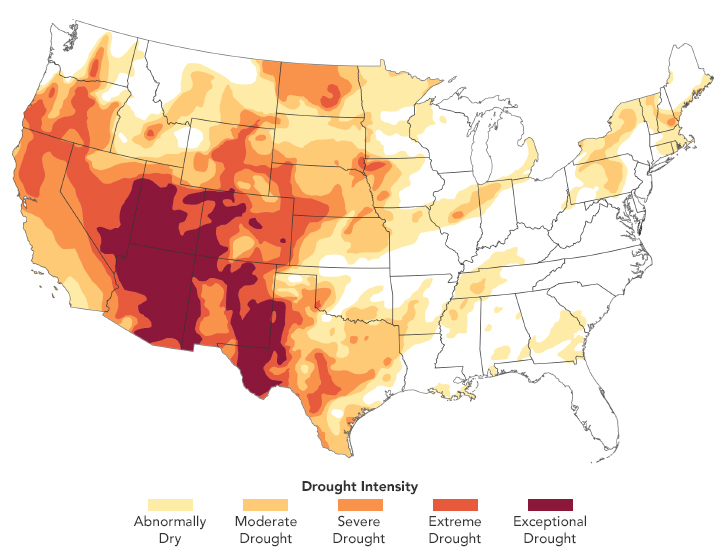
Target variable: The U.S. Drought Monitor (USDM) is produced through a partnership
between
the National Drought Mitigation Center at the University of Nebraska-Lincoln, the United States
Department
of Agriculture, and the National Oceanic and Atmospheric Administration. It provides for each of the
3058
studied counties a continuous drought score ranging from 0 to 5, once per week and for each county, but
is
often presented in 5 classes (No Drought - Exceptional Drought). The particularity of this drought score
is
that it combines multiple drought indices or indicators to create a unique metric, that results in being
a
more objective drought value. Is is a combination of the Palmer Drought Severity Index (PDSI), of the
CPC
Soil Moisture Model,and of the Standardized Precipitation Index (SPI). As the score is provided on a
weekly
basis, we interpolate it for convenience in the model development.
Approach
Regression task
After exploring, analyzing and cleaning the data, I compare multiple models. The target variable is a continuous score that is regressed. However, to stick to USDM's 6 scores categories, I bin the predicted drought scores in the 6 drought severity categories and compute the forecasting average Macro F1 score. With the forecasting MSE, these are the two main performance metrics that are monitored.
Modeling
I compared multiple forecasting methods:
Naive models: Two Naive models that represent the performance baseline: an
identity-model that uses current drought scores as predictions, and a model that interpolates droughts
based on the two last droughts scores.
ML models: Classic ML techniques (Ridge regression, Gradient
Boosted Trees). Weather observations are flattened or averaged to take into account long-term
dependencies between weather and droughts. Different combinations of regularization, time window (how
far we look in the past), and features are tested to best solve the problem.
LSTM: Using the best set of features found while devising ML models.